
About PonTan Chart
overview
The PonTan chart displays price movements over a 5-day period, including the day recorded in the diary. Only 15 minute charts are displayed. You can zoom in and out with the mouse wheel, and scroll left and right to check past price movements. The vertical line represents the International Date Line and is always visible, but the date at the bottom may be omitted depending on the magnification. The chart for the current day is automatically updated every 15 minutes. When the date changes, only the charts corresponding to the diary for that day will be updated from then on, and the charts for other dates will remain fixed. The purpose of this is to "keep a history of the charts you were viewing in real time on that day."
There are four currency pairs that can be displayed:
- USDJPYUS Dollar/Japanese Yen
- EURUSDEuro to US Dollar
- GBPUSDBritish Pound / US Dollar
- AUDUSDAustralian Dollar to US Dollar
PonTan basically only trades dollar straights.
This is because technical analysis is more effective than with cross currencies, making trading decisions easier to make.
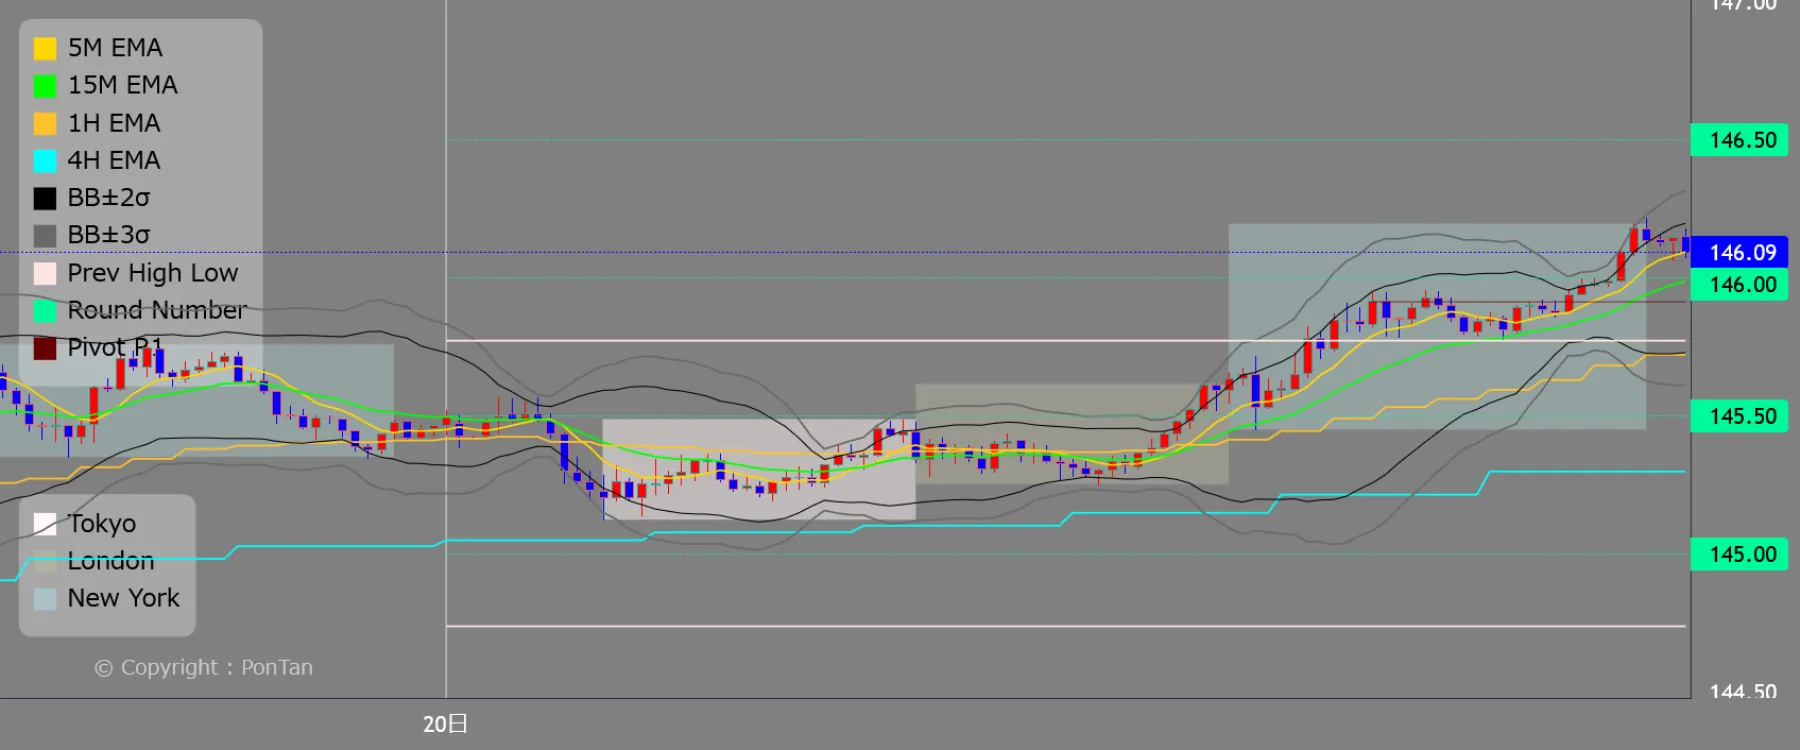
List of displayed indicators

5M EMA: Auxiliary lines for capturing ultra-short-term trends
15M EMA: Visualize short-term wave direction
1H EMA: Medium-term trend guide
4H EMA: Complementing the overall market trend
BB±2σ: Typical Volatility Ranges
BB±3σ: Overheated/Under-signal range
Prev High Low: Previous day's high and low prices
Round Number: Round prices (psychological milestones)
Pivot Point (PP): The center of gravity of the current day's price calculated from the previous day's high, low, and closing prices
Pivot R1: First Resistance Line
Pivot R2: The second resistance line
Pivot R3: The third resistance line
Pivot R4: Fourth Resistance Line
Pivot R5: Fifth Resistance Line
Pivot S1: The first support line
Pivot S2: The second support line
Pivot S3: The third support line
Pivot S4: The fourth support line
Pivot S5: Fifth support line
*Pivot lines (S1 to S5 / R1 to R5) and Round Numbers will only be displayed on the chart when the price reaches them.
Display by market
The chart background displays bands for each session.
Tokyo Time
London Time
New York Time
Indicator Advanced Settings
15M EMA: 15-minute exponential moving average
1H EMA: 1-hour exponential moving average
4H EMA: 4-hour exponential moving average
BB±2σ: Bollinger Bands 2σ
BB±3σ: Bollinger Bands 3σ
FX Journal